Please upgrade your web browser now. Internet Explorer 6 is no longer supported.>

Why Is Air Monitoring Important for Global Buyers?

Air quality is no longer only a local facility concern. For global buyers, it can influence worker safety, product consistency, delivery confidence, and supplier reputation. Air Monitoring provides measurable evidence about conditions inside factories, warehouses, laboratories, and loading areas. A clear dashboard may show particulate matter, volatile organic compounds, humidity, temperature, or carbon dioxide levels. These details turn vague concerns into reviewable business information.

Yet monitoring is not a magic solution. Sensors can drift, sampling points can miss a busy production corner, and one clean reading cannot represent an entire shift. Buyers should ask how instruments are calibrated, where they are installed, who reviews alerts, and how records are retained. Reliable programs usually combine suitable technology, trained personnel, documented procedures, and independent verification when risks are significant. This supports practical decisions, such as improving ventilation before a shipment is delayed or protecting sensitive goods from excess moisture.

Real purchasing experience reveals a common weakness: suppliers may present impressive charts without explaining unusual gaps. Buyers should examine trends, maintenance logs, corrective actions, and local operating conditions. Small details matter. A blocked inlet matters. So does a door left open near a sensor. Air Monitoring becomes valuable when its data is understood, questioned, and connected to responsible action. It cannot remove every uncertainty, but it can make hidden risks easier to see.
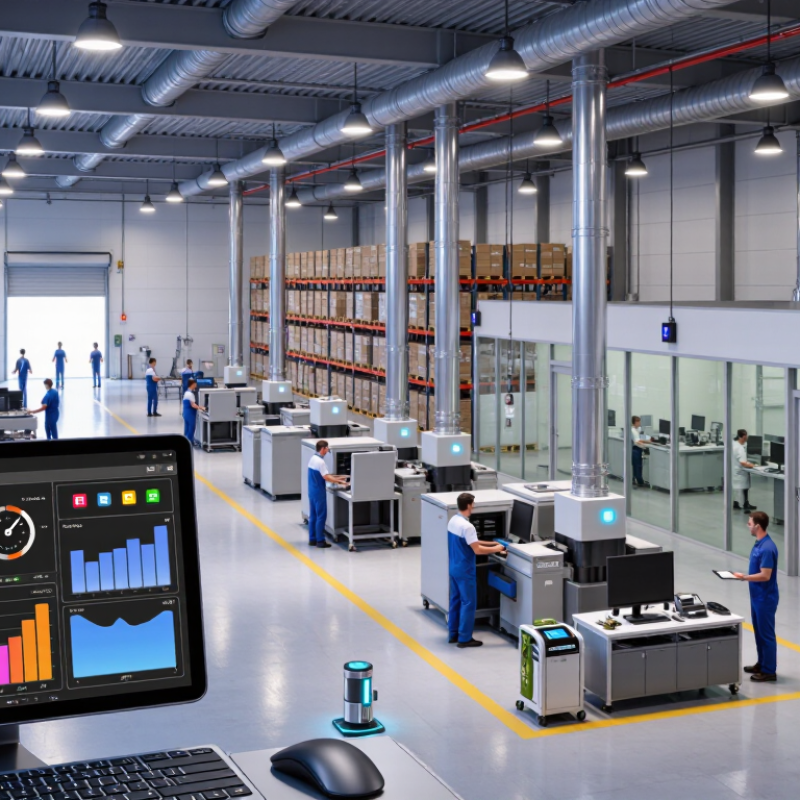
Why Is Air Monitoring Important for Global Buyers?

Air Monitoring Defined: PM2.5, PM10, VOCs, CO₂, and Dust

Why Is Air Monitoring Important for Global Buyers?

Air monitoring turns an invisible risk into procurement evidence. For global buyers, key measures include PM2.5, PM10, VOCs, CO₂, and dust. PM2.5 can enter deep lung tissue. PM10 is larger, but still affects the respiratory system. The WHO 2021 Air Quality Guidelines recommend annual limits of 5 µg/m³ for PM2.5 and 15 µg/m³ for PM10. WHO reported 4.2 million premature deaths from ambient air pollution in 2019. That makes sensor data more than a technical detail.

VOCs may come from paints, adhesives, plastics, cleaning products, and stored materials. Some cause irritation; others require compound-specific assessment. Total VOC readings help identify changes, but they cannot identify every hazard. For formaldehyde, WHO’s indoor air quality guidance recommends 0.1 mg/m³ over 30 minutes. CO₂ is different. It mainly indicates ventilation performance, not complete air safety. Dust monitoring adds practical insight. Particles may settle on cartons, filters, and machinery before buyers notice them. One uncomfortable lesson remains: low CO₂ does not prove low VOCs.

Tips: Request time-stamped data, calibration records, and sampling maps. Place monitors near breathing zones, not only near exhaust vents. Compare readings across shifts and seasons. Do not treat one clean afternoon as proof. Sampling choices can quietly distort purchasing decisions.

Health Evidence: WHO Attributes 4.2 Million Deaths Yearly to Outdoor Air Pollution

Why Is Air Monitoring Important for Global Buyers?

The World Health Organization attributes about 4.2 million premature deaths each year to outdoor air pollution. This estimate concerns ambient pollution, including fine particulate matter, nitrogen dioxide, and ozone. These pollutants can travel across borders and enter cities, factories, ports, and logistics areas. For global buyers, air monitoring is not only an environmental task. It supports worker protection, supplier evaluation, and responsible purchasing decisions.

A reliable monitoring plan can reveal pollution peaks near loading bays, roads, or production lines. For example, a brief PM2.5 spike during truck activity may expose a weakness in site controls. Buyers should review calibration records, sampling locations, maintenance history, and data completeness. Local regulations may differ, so one certificate cannot prove universal compliance. A clean dashboard is not proof. Data can still be incomplete, poorly placed, or misunderstood. That uncomfortable possibility deserves attention.

Tips: Ask suppliers for recent air-quality records and explain how readings were collected. Compare indoor and outdoor measurements when possible. Check whether sensors were calibrated under local conditions. Request evidence of corrective action after unusual results. Do not rely on a single reading; pollution changes with weather, traffic, and operating hours. Simple checks often reveal more than polished reports.

Why Is Air Monitoring Important for Global Buyers? - Health Evidence: WHO Attributes 4.2 Million Deaths Yearly to Outdoor Air Pollution
Monitoring Dimension Pollutant or Indicator WHO Air Quality Guideline Health Evidence Why It Matters to Global Buyers Common Measurement Basis
Global health burden Ambient air pollution 4.2 million premature deaths per year WHO estimated that ambient, or outdoor, air pollution caused approximately 4.2 million premature deaths worldwide in 2019. Air-quality performance can affect worker protection, regulatory compliance, public-health risk, and continuity of operations across supply chains. Population exposure assessments, ambient monitoring networks, satellite observations, and atmospheric models.
Particulate matter PM2.5 5 µg/m³ annual mean
15 µg/m³ 24-hour mean
Fine particles can penetrate deep into the lungs and are associated with cardiovascular disease, respiratory disease, lung cancer, and premature mortality. PM2.5 is a key indicator for comparing air quality between production locations, logistics hubs, and worker environments. Continuous or periodic measurements using reference-grade or appropriately validated particulate monitors.
Coarse particulate matter PM10 15 µg/m³ annual mean
45 µg/m³ 24-hour mean
PM10 can enter the respiratory system and is linked with respiratory irritation, aggravated asthma, and other adverse respiratory outcomes. Useful for evaluating dust from construction, mining, road transport, material handling, and industrial activity. Gravimetric samplers, beta attenuation monitors, optical particle counters, or equivalent validated methods.
Combustion-related pollution Nitrogen dioxide (NO₂) 10 µg/m³ annual mean
25 µg/m³ 24-hour mean
NO₂ can irritate the airways and is associated with respiratory symptoms, reduced lung function, and asthma-related effects. Important near roads, ports, generators, boilers, and facilities using combustion-based equipment. Electrochemical, chemiluminescence, or other validated ambient NO₂ monitoring methods.
Photochemical pollution Ozone (O₃) 100 µg/m³ 8-hour mean
60 µg/m³ peak-season mean
Ground-level ozone can cause airway inflammation, reduce lung function, and worsen asthma and other respiratory conditions. Relevant for outdoor work, agricultural sourcing, transportation corridors, and regions with strong sunlight and high precursor emissions. Ultraviolet photometric analyzers or equivalent validated ozone monitoring systems.
Sulfur-containing emissions Sulfur dioxide (SO₂) 40 µg/m³ 24-hour mean SO₂ can irritate the respiratory tract and is particularly harmful to people with asthma and other respiratory conditions. Relevant where fuel oil, coal, metal processing, shipping, or other sulfur-emitting activities may affect local air quality. Ultraviolet fluorescence, ultraviolet absorption, or other validated SO₂ monitoring methods.
Incomplete combustion Carbon monoxide (CO) 4 mg/m³ 24-hour mean CO reduces the blood’s oxygen-carrying capacity and can create serious risks at elevated concentrations, especially in enclosed or poorly ventilated areas. Important for warehouses, enclosed loading areas, garages, facilities using combustion equipment, and transport operations. Non-dispersive infrared analyzers or other validated CO monitoring methods.
Exposure duration Annual, 24-hour, 8-hour, and peak-season averages Multiple averaging periods Short-term peaks and long-term exposure can create different health risks; one averaging period cannot fully describe exposure. Buyers can use multiple time horizons to assess chronic risk, acute episodes, seasonal variation, and operational resilience. Continuous monitoring, time-weighted averages, daily maximum values, and seasonal data analysis.
Data quality Calibration and validation status Documented quality assurance required Reliable health-risk assessment depends on accurate, comparable, and traceable measurements. Calibration records, detection limits, data completeness, and method validation help buyers compare suppliers and sites objectively. Calibration logs, certified reference materials, co-location studies, audits, and documented quality-control procedures.
Reference: World Health Organization, Global Air Quality Guidelines (2021) and ambient air pollution health-impact estimates. Guideline values are health-based recommendations and may differ from legally enforceable national standards.

Workplace Risk: ILO Reports 2.93 Million Annual Work-Related Deaths

Why Is Air Monitoring Important for Global Buyers?

Workplace Risk: ILO Reports 2.93 Million Annual Work-Related Deaths

The International Labour Organization reported 2.93 million work-related deaths each year in 2023. About 2.6 million resulted from work-related diseases, while roughly 330,000 followed workplace accidents. These figures make air quality a purchasing concern, not merely a factory issue. Dust, welding fumes, silica, and volatile chemicals can enter a worker’s breathing zone during an ordinary eight-hour shift.

Small details matter. A personal sampler clipped near the collar can reveal exposure that a wall-mounted monitor misses. Buyers should request sampling dates, tested substances, laboratory methods, calibration records, and corrective actions. Results should be compared with recognized occupational exposure limits, not only local internal targets. The WHO and ILO joint estimates also linked long working hours to 745,000 deaths from stroke and ischemic heart disease in 2016. Air hazards add another layer of risk.

Paperwork can look reassuring.

Yet one clean test does not prove continuous control. Production volume, ventilation, raw materials, and worker behavior can change quickly. Buyers should review repeated measurements across shifts and seasons. They should also check whether workers understand alarms and respirator requirements. In practice, monitoring programs are sometimes incomplete, including mine. That weakness deserves attention. Reliable sourcing requires evidence, technical review, and honest follow-up rather than a single impressive certificate.

Compliance Framework: Apply WHO 2021 Guidelines and ISO 16000 Methods

For global buyers, air monitoring is more than a technical check. It provides evidence that a product, building, or workplace meets recognized health expectations. The WHO 2021 Air Quality Guidelines offer health-based reference levels for PM2.5, PM10, ozone, nitrogen dioxide, sulfur dioxide, and carbon monoxide. These values help buyers compare supplier data across markets. They are guidelines, not automatic legal limits. Local regulations still govern procurement decisions. This distinction matters during audits, where a report may appear acceptable but fail a national requirement.

ISO 16000 methods provide a practical framework for indoor air assessment. Depending on the purpose, teams may measure volatile organic compounds, formaldehyde, particles, or microbial conditions. Sampling location, duration, flow rate, temperature, and humidity should be recorded. A sensor in a busy loading area cannot represent a sealed office. Neither can one afternoon prove yearly performance. Calibrated equipment and trained personnel improve reliability. Laboratory results should include units, detection limits, uncertainty, and method references. Without these details, numbers become decoration.

A dependable buying process connects each result to a clear decision. Buyers can request baseline readings before shipment and repeat testing after installation. Unexpected peaks deserve investigation, not immediate blame. Cleaning chemicals, new furniture, traffic, and ventilation changes may alter results. A perfect framework still depends on imperfect sampling. That weakness is easy to overlook. Data should also be reviewed by qualified professionals who understand exposure, building conditions, and local compliance duties.

Buyer Verification: Use Real-Time Data to Audit Supplier Air-Quality Controls

Air monitoring is no longer a distant compliance issue for global buyers. It is a practical way to verify supplier controls before production risks become costly. The World Health Organization’s 2022 Air Quality Database reported that 99% of people breathe air exceeding its guideline limits. Fine particles remain a serious concern.

Real-time data gives buyers a clearer audit trail. Ask suppliers for timestamped PM2.5, PM10, carbon dioxide, temperature, and humidity records. Compare readings with production shifts, ventilation changes, and maintenance logs. The United States Occupational Safety and Health Administration emphasizes exposure monitoring, control measures, and documented corrective action in workplace programs. A live dashboard alone is not proof.

Sensor quality matters. Sensor drift happens. Require calibration certificates, maintenance records, location maps, and access to historical data. Independent sampling can test whether digital readings match actual conditions. The International Labour Organization’s Safety and Health at Work report links effective prevention with reliable workplace information and worker participation. Buyers should also interview operators near loading areas, cutting stations, and chemical storage rooms. Their observations may reveal odors, dust, or blocked vents that sensors miss.

A supplier may present excellent weekly averages while hiding short pollution spikes. That weakness deserves attention. Use automated alerts, random review windows, and corrective-action deadlines. Keep the original data, not only screenshots. Even experienced auditors can overtrust polished dashboards. Real verification requires technical evidence, site experience, and the willingness to question convenient results.